
[fusion_builder_container hundred_percent=”no” hundred_percent_height=”no” hundred_percent_height_scroll=”no” hundred_percent_height_center_content=”yes” equal_height_columns=”no” menu_anchor=”” hide_on_mobile=”no” class=”” id=”” background_color=”” background_image=”” background_position=”left top” background_repeat=”no-repeat” fade=”no” background_parallax=”none” enable_mobile=”no” parallax_speed=”0.3″ video_mp4=”” video_webm=”” video_ogv=”” video_url=”” video_aspect_ratio=”16:9″ video_loop=”yes” video_mute=”yes” video_preview_image=”” border_size=”0px” border_color=”” border_style=”solid” margin_top=”” margin_bottom=”” padding_top=”4%” padding_right=”” padding_bottom=”” padding_left=””][fusion_builder_row][fusion_builder_column type=”1_6″ layout=”1_6″ spacing=”0px” center_content=”no” link=”” target=”_self” min_height=”” hide_on_mobile=”medium-visibility,large-visibility” class=”” id=”” background_color=”” background_image=”” background_position=”left top” undefined=”” background_repeat=”no-repeat” hover_type=”none” border_size=”0″ border_color=”” border_style=”solid” border_position=”all” padding_top=”” padding_right=”” padding_bottom=”” padding_left=”” margin_top=”” margin_bottom=”” animation_type=”” animation_direction=”left” animation_speed=”0.3″ animation_offset=”” last=”no”][/fusion_builder_column][fusion_builder_column type=”2_3″ layout=”2_3″ spacing=”0px” center_content=”no” link=”” target=”_self” min_height=”” hide_on_mobile=”no” class=”” id=”” background_color=”” background_image=”” background_position=”left top” undefined=”” background_repeat=”no-repeat” hover_type=”none” border_size=”0″ border_color=”” border_style=”solid” border_position=”all” padding_top=”” padding_right=”” padding_bottom=”” padding_left=”” margin_top=”” margin_bottom=”” animation_type=”” animation_direction=”left” animation_speed=”0.1″ animation_offset=”” last=”no”][fusion_text columns=”” column_min_width=”” column_spacing=”” rule_style=”default” rule_size=”” rule_color=”” hide_on_mobile=”small-visibility,medium-visibility,large-visibility” class=”” id=””]
Knowledge Brief – Introduction to Correlations and Regressions
When we talk about statistical analysis correlation and regression are the two major terms that we have to understand in order to comprehend what the information is telling us. From an initial attempt these terms might seem complicated to understand so below I try to breakdown what these two terms mean and entail in a very broad level, but enough to get you to understand what they are and how they differ.
[/fusion_text][fusion_separator style_type=”none” hide_on_mobile=”small-visibility,medium-visibility,large-visibility” class=”” id=”” sep_color=”” top_margin=”10px” bottom_margin=”” border_size=”” icon=”” icon_circle=”” icon_circle_color=”” width=”” alignment=”center” /][fusion_text columns=”” column_min_width=”” column_spacing=”” rule_style=”default” rule_size=”” rule_color=”” class=”” id=””]
Correlations
Correlations – degree and type of relationship between any two or more variables in which they vary together over a period; A positive correlation exists where the high values of one variable are associated with the high values of the other variable(s). A ‘negative correlation’ means association of high values of one with the low values of the other(s).
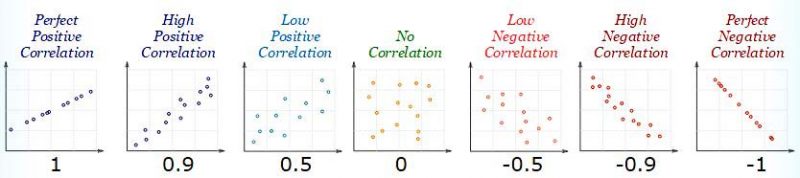
Correlations can vary from +1 to -1. Values close to +1 indicate a high-degree of positive correlation, and values close to -1 indicate a high degree of negative correlation.
[/fusion_text][fusion_separator style_type=”none” hide_on_mobile=”small-visibility,medium-visibility,large-visibility” class=”” id=”” sep_color=”” top_margin=”10px” bottom_margin=”” border_size=”” icon=”” icon_circle=”” icon_circle_color=”” width=”” alignment=”center” /][fusion_text columns=”” column_min_width=”” column_spacing=”” rule_style=”default” rule_size=”” rule_color=”” class=”” id=””]For the purpose of visualizing what different correlation values look like in a scatterplot, I have including an image below showing examples of different correlational coefficients (values).
 [/fusion_text][fusion_separator style_type=”default” hide_on_mobile=”small-visibility,medium-visibility,large-visibility” class=”” id=”” sep_color=”” top_margin=”” bottom_margin=”” border_size=”” icon=”” icon_circle=”” icon_circle_color=”” width=”” alignment=”center” /][fusion_text columns=”” column_min_width=”” column_spacing=”” rule_style=”default” rule_size=”” rule_color=”” class=”” id=””]
Regressions
Regressions – statistical process estimating the relationship among variables. More specifically, regression analysis helps us understand how a dependent variable changes when any independent variable is varied. Most common, regression analysis estimates the expectation of the dependent variable given the independent variable.

What is R-squared?
R-squared is a statistical measure of how close the data are to the fitted regression line. It is also known as the coefficient of determination, or the coefficient of multiple determinations for multiple regressions. The definition of R-squared is fairly straightforward; it is the percentage of the response variable variation that is explained by a linear model.
In other words, R-squared is always between 0 and 100% [0 and 1]:
- 0% [0] indicates that the model explains none of the variability of the response data around its mean
- 100% [1] indicates that the model explains all the variability of the response data around its mean
What is the difference between Correlations and Regressions?
The difference between correlation and regression is that we can only get an index describing the linear relationship between two variables with correlation. A regression can help us predict the relationship between two or more variables and we can use it to identify which variables (x) can predict the outcome of variable (y).[/fusion_text][/fusion_builder_column][fusion_builder_column type=”1_6″ layout=”1_6″ spacing=”0px” center_content=”no” link=”” target=”_self” min_height=”” hide_on_mobile=”medium-visibility,large-visibility” class=”” id=”” background_color=”” background_image=”” background_position=”left top” undefined=”” background_repeat=”no-repeat” hover_type=”none” border_size=”0″ border_color=”” border_style=”solid” border_position=”all” padding_top=”” padding_right=”” padding_bottom=”” padding_left=”” margin_top=”” margin_bottom=”” animation_type=”” animation_direction=”left” animation_speed=”0.3″ animation_offset=”” last=”no”][/fusion_builder_column][/fusion_builder_row][/fusion_builder_container]